Disclaimer

Dislaimer

The information contained in this document is for background purposes only, does not purport to be full or complete, does not constitute investment advice and may not be relied on. In particular, strategies have been and will continue to be adjusted, modified, developed, added and/or removed, and there can be no assurance that the Fund will in the future exhibit the same target risk allocations or other characteristics noted herein. On the contrary, these characteristics will change in the future, perhaps materially. No prospective investor should invest based on the information contained herein.

CLOSE
Global transport transition research

Global EV switching economics

Explore how expected energy prices change the relative economics of electric vehicles across the global road-transport market. Harmony’s segment assumptions remain fixed unless advanced mode is selected.

  • Allocates modeled purchase-price and maintenance costs across modeled lifetime miles
  • Uses representative efficiency for each vehicle segment and technology
  • Models annual global road-transport activity across seven vehicle segments

Regional energy-price reference

Recent U.S. EIA benchmarks can help frame—but should not dictate—your global assumptions.

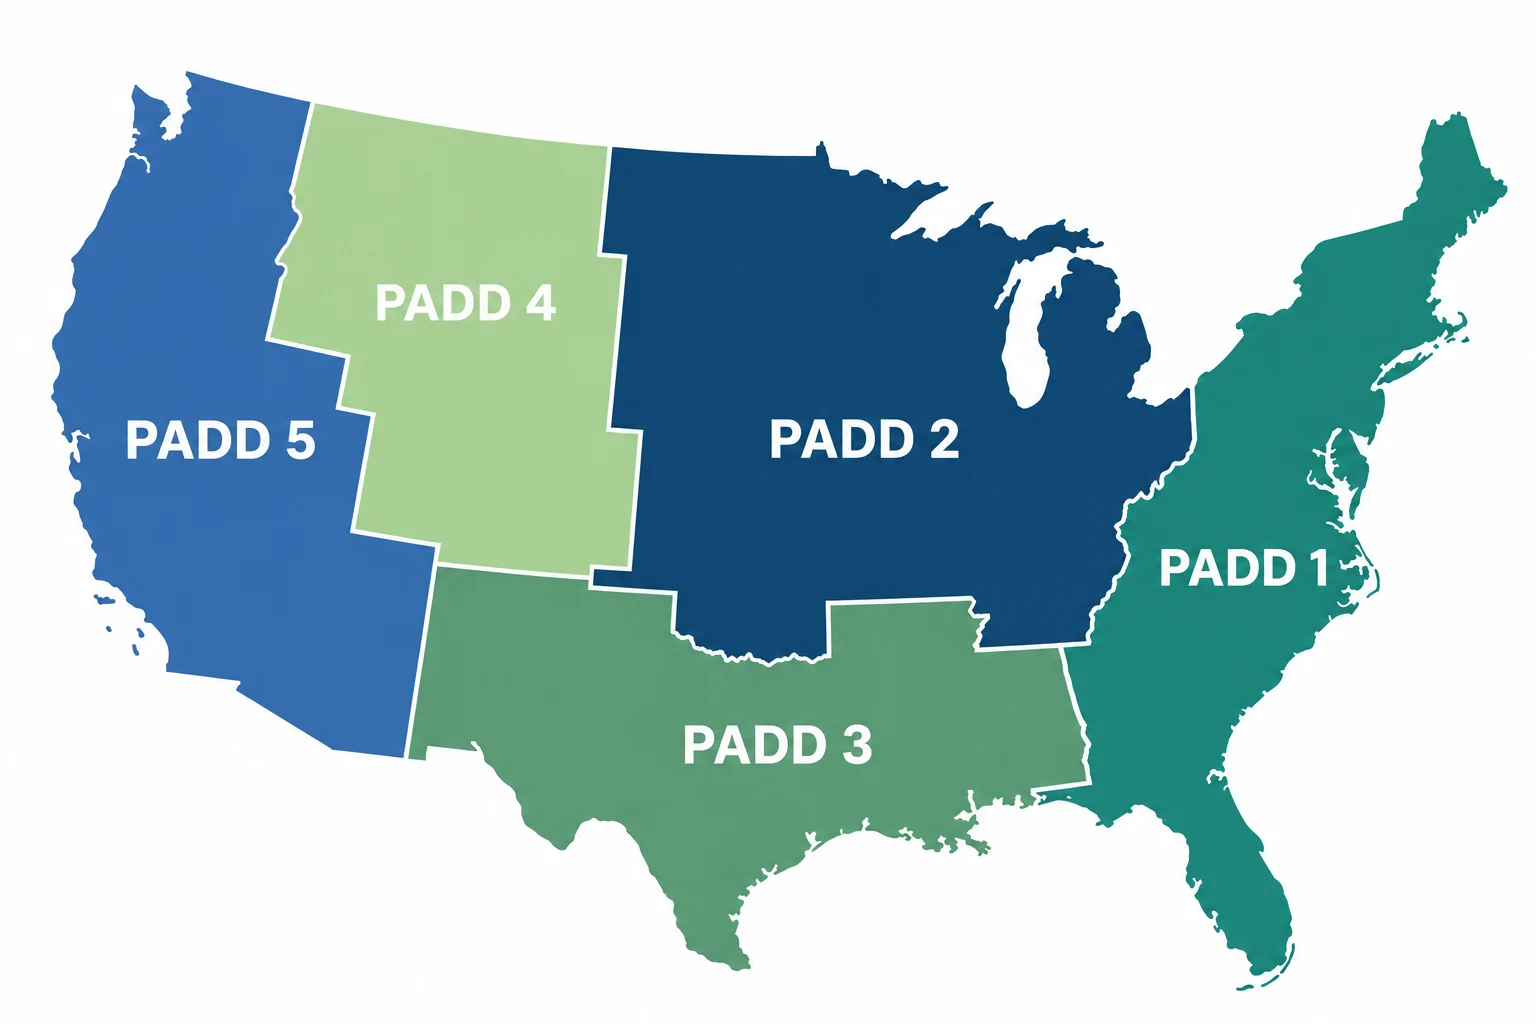
Simplified map of the five U.S. EIA petroleum regions labeled PADD 1 through PADD 5
Simplified from official U.S. EIA PADD boundaries; colors adapted by Harmony Capital.

Choosing an assumption

  • Select any regional tile below to populate both energy inputs; you can still edit either value afterward.
  • Gasoline shows a four-week average through September 28, 2026. Electricity shows residential prices for 2026 year to date through July.
  • Your local price is useful for a personal comparison. For the full-switch model, consider expected pricing across the global vehicle fleet and all seven segments.
  • Commercial and fleet charging prices may differ from residential electricity.
Electricity regions are Harmony Capital aggregations of EIA state residential revenue and sales aligned to the five petroleum regions.

Expected energy prices

Enter your own forward assumptions. Results update across all seven segments.

$
$
Auto: gasoline × 1.18 · EIA U.S. 2021–2025 proxy
$
Passenger EV advantage—per passenger-car mile
Savings per passenger vehicle life—modeled lifetime ownership savings
Modeled annual full-switch value—across all modeled annual miles

Economics by modeled global vehicle segment

Lifetime savings translate each cost-per-mile result into a relatable per-vehicle view. The highlighted passenger-car row connects to the summary above; the final column shows the modeled annual value of switching all modeled miles to the EV cost structure.

EV advantageICE advantage
SegmentICE fuelHarmony Capital
Modeled Global Miles
(bn/yr)
EV share
of miles
ICE cost
$/mile
EV cost
$/mile
EV advantage
$/mile
Savings per vehicle
$/life
Modeled annual
full-switch value
$bn/yr
—

Advanced segment assumptions

Edit Harmony model defaults. Superscripts map to the source key; modeled values are not presented as direct observations.

SegmentICE MPG1EV mi/kWh1Harmony Capital
Modeled Annual Miles2
(per vehicle)
Harmony Capital
Modeled Lifetime Miles2
Harmony Capital
Modeled Global Miles3
(bn/yr)
ICE price4
$
EV price4
$
ICE maint.5
$ life
EV maint.5
$ life
EV mi share6
%
Advanced changes affect this browser session only. Reset returns every segment to the reviewed 2024 workbook baseline.
Advanced-input source key
  1. Efficiency: EPA Automotive Trends/DOE AFDC for light duty; Argonne AFLEET benchmarks for commercial vehicles. Segment values are Harmony representative assumptions.
  2. Modeled annual and lifetime miles: Harmony Capital assumptions informed by vehicle age, survival and annual-mileage benchmarks. Lifetime miles drive the per-vehicle lifetime output; annual miles support the implied-vehicle weighting in the total row.
  3. Modeled global miles: Harmony Capital scenario allocation informed by international passenger, freight and vehicle-activity indicators from ITF, OICA, IEA, UNCTAD and regional fleet evidence; it is not an official reported series.
  4. Purchase price: market/OEM and IEA/Argonne benchmarks normalized to USD; rounded segment averages, not a quoted global price.
  5. Maintenance: DOE AFDC/AFLEET evidence supplemented by fleet studies; shown as modeled lifetime totals.
  6. EV mileage share: Harmony assumption informed by IEA stock-by-mode data and a modeled utilization adjustment; it is not EV sales share and does not affect the full-switch value.

How the global model works

For each segment, the model estimates energy, purchase-price and maintenance costs per mile for internal-combustion-engine (ICE) and battery-electric-vehicle (EV) cost structures. Purchase price and lifetime maintenance are divided by Harmony Capital Modeled Lifetime Miles; energy cost is calculated from the selected fuel or electricity price and modeled efficiency. The weighted total uses each segment’s share of Harmony Capital Modeled Global Miles.

The model does not include financing, depreciation or resale value, incentives, taxes, insurance, charging infrastructure, downtime or discounting.

ICE $/mile = fuel price ÷ miles per gallon (MPG) + ICE price ÷ lifetime miles + ICE maintenance ÷ lifetime miles
EV $/mile = electricity price ÷ miles per kilowatt-hour (mi/kWh) + EV price ÷ lifetime miles + EV maintenance ÷ lifetime miles
EV advantage = ICE $/mile − EV $/mile
Weighted result = Σ(segment result × Harmony Capital Modeled Global Miles) ÷ Σ(Harmony Capital Modeled Global Miles)

Harmony Capital Modeled Global Miles

The workbook’s 15.55 trillion annual miles are a Harmony Capital scenario allocation of international road-transport activity across passenger cars, SUVs, light pickups, commercial vans, medium-duty trucks, heavy-duty trucks and buses. The values are not a directly reported series from the International Transport Forum (ITF), International Energy Agency (IEA) or another provider.

The allocation is informed by international passenger-transport, freight-transport, vehicle-stock and utilization indicators from ITF, the International Organization of Motor Vehicle Manufacturers (OICA), IEA, the United Nations Conference on Trade and Development (UNCTAD) and regional sources, together with Harmony Capital modeling assumptions. Lifetime miles are separate Harmony Capital assumptions and do not drive the global-mile allocation.

Interpretation: Harmony Capital Modeled Global Miles should be read as research assumptions informed by cited transport indicators, not as official estimates or a directly observed global mileage series.

Vehicle-technology definition

“EV” refers to a battery-electric vehicle operating entirely on electricity. Conventional hybrids and plug-in hybrids are not modeled as separate technologies. EV mileage share is presented for market context and does not affect the modeled full-switch value.

Energy-price references

The regional panel uses static U.S. Energy Information Administration (EIA) retail observations to help users frame their own forward assumptions; the current calculator does not automatically retrieve external data. Gasoline presets reflect the four-week average of EIA regular-gasoline prices through September 28, 2026. Residential electricity presets are Harmony Capital calculations using EIA state revenue and sales for January through July 2026, aggregated into the same five petroleum regions. These U.S. observations are context, not global averages.

Automatic diesel assumption

Unless manual mode is selected, diesel equals the user’s gasoline assumption multiplied by 1.18. This is a rounded five-year U.S. retail proxy based on EIA regular-gasoline and on-highway diesel prices for 2021–2025; it is not a global pump-price ratio. Users may override it by selecting Manual.

Modeled annual full-switch value

This scenario multiplies each segment’s EV advantage per mile by Harmony Capital Modeled Global Miles for one year. It assumes all modeled miles move from the ICE cost structure to the battery-electric cost structure; it is not a forecast of adoption or realizable savings.

Sources, limitations and data dates

Static releaseEnergy-price referencesGasoline presets reflect the four-week average of U.S. Energy Information Administration (EIA) regular-gasoline prices through September 28, 2026. Electricity presets use EIA state residential revenue and sales year to date through July 2026; Harmony divides revenue by sales and aggregates states into the five petroleum regions. EIA fuel prices · EIA electricity revenue · EIA electricity sales
Harmony assumptionBattery-electric vehicle (EV) stock and mileage shareInternational Energy Agency (IEA) stock indicators by mode inform the displayed EV mileage-share assumptions. The utilization adjustment is modeled by Harmony Capital; the resulting mileage share is not an observed series and does not affect the full-switch calculation. IEA Global EV Data Explorer
Harmony assumptionsEfficiency and lifetimeSegment efficiency values are representative Harmony Capital assumptions informed by U.S. Environmental Protection Agency (EPA) Automotive Trends, U.S. Department of Energy (DOE) Alternative Fuels Data Center (AFDC) and Argonne National Laboratory Alternative Fuel Life-Cycle Environmental and Economic Transportation (AFLEET) benchmarks. Annual and lifetime miles are separate Harmony Capital assumptions informed by vehicle-age, survival and mileage evidence. EPA Trends · EPA Motor Vehicle Emission Simulator (MOVES) · AFLEET
Scenario allocationHarmony Capital Modeled Global MilesNo official source reports global annual miles using the model’s seven-segment taxonomy. Harmony Capital allocates a modeled total across the seven classes using international passenger, freight, vehicle-stock and utilization indicators from the International Transport Forum (ITF) and the International Organization of Motor Vehicle Manufacturers (OICA). International transport statistics · OICA
Modeled inputsPurchase price and maintenancePurchase-price assumptions draw on manufacturer list prices and broader vehicle-market observations. Maintenance assumptions draw on DOE AFDC and Argonne AFLEET cost evidence. Because no single source covers all seven segments globally, Harmony Capital combines these inputs into representative estimates intended as close approximations for each segment, rather than quoted global averages. DOE cost method · DOE maintenance · Argonne AFLEET
Scenario analysis based on modeled assumptions. “Harmony Capital Modeled Global Miles” denotes a Harmony Capital scenario allocation informed by cited international transport indicators and modeling assumptions. Results are not investment, tax or purchasing advice.